Broadly, our work includes
- Building support systems for MGM members of all identities, backgrounds, and departmental roles
- Making culture, engagement and impact a central part of MGM’s research, education, and outreach
- Promoting equity in MGM’s hiring and recruitment
- Organizing community-building activities for the department
- Communicating transparently about our progress to keep us accountable to our goals and to elicit feedback from the department as a whole
Demographic data:
These data come from the Graduate School.
Note: race and ethnicity data is only tracked for US citizens and permanent residents (82% of students in 2022-2023).
2022-2023
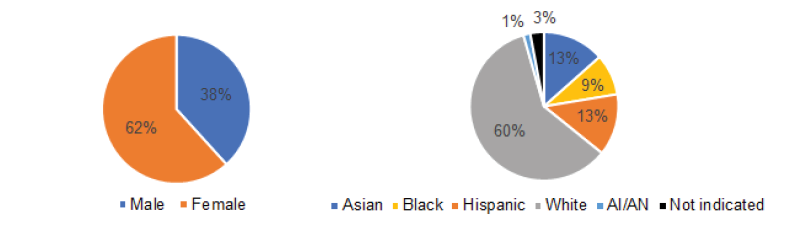
- 61% Female, 39% Male
- 9% Asian, 7% Black, 9% Hispanic, 73% White, 2% AI/AN
2020-2021
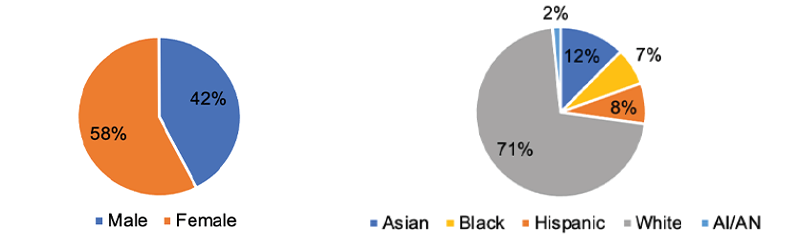
- 58% Female, 42% Male
- 12% Asian, 7% Black, 8% Hispanic, 71% White, 2% AI/AN
Note: race and ethnicity are only tracked for US citizens and permanent residents
2021-2022
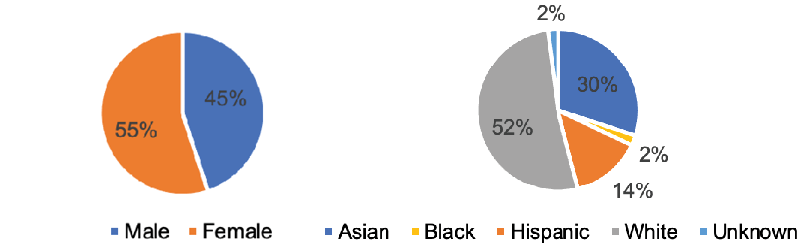
- 55% Female, 45% Male
- 30% Asian, 2% Black, 14% Hispanic, 52% White, 2% Unknown
2020-2021
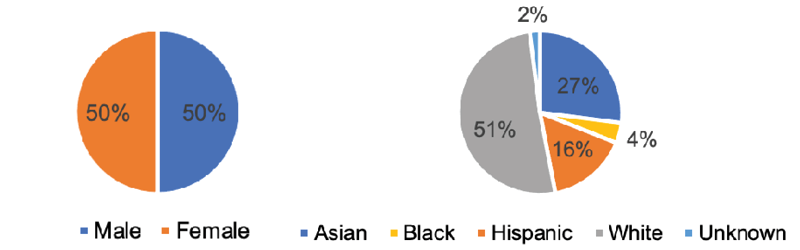
- 50% Female, 50% Male
- 27% Asian, 4% Black, 16% Hispanic, 51% White, 2% Unknown
2021-2022
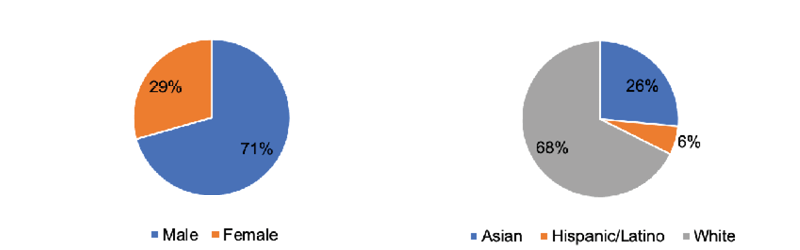
- 71% Male, 29% Female
- 26% Asian, 6% Hispanic/Latino, 68% White
We summarize demographic data as it is collected by Duke as an institution, which uses a merged race and ethnicity category and does not report a percentage of individuals with multiracial background.